Thermodynamics Chat Support Connect to Thermodynamics
Message to Thermodynamics

Request a Quote

Dubai
+971 ▾
  • Afghanistan +93
  • Åland Islands +358
  • Albania +355
  • Algeria +213
  • American Samoa +1
  • Andorra +376
  • Angola +244
  • Anguilla +1
  • Antigua and Barbuda +1
  • Argentina +54
  • Armenia +374
  • Aruba +297
  • Australia +61
  • Austria +43
  • Azerbaijan +994
  • Bahamas +1
  • Bahrain +973
  • Bangladesh +880
  • Barbados +1
  • Belarus +375
  • Belgium +32
  • Belize +501
  • Benin +229
  • Bermuda +1
  • Bhutan +975
  • Bolivia +591
  • Bosnia and Herzegovina +387
  • Botswana +267
  • Brazil +55
  • British Indian Ocean Territory +246
  • British Virgin Islands +1
  • Brunei +673
  • Bulgaria +359
  • Burkina Faso +226
  • Burundi +257
  • Cambodia +855
  • Cameroon +237
  • Canada +1
  • Cape Verde +238
  • Caribbean Netherlands +599
  • Cayman Islands +1
  • Central African Republic +236
  • Chad +235
  • Chile +56
  • China +86
  • Christmas Island +61
  • Cocos (Keeling) Islands +61
  • Colombia +57
  • Comoros +269
  • Congo +243
  • Congo +242
  • Cook Islands +682
  • Costa Rica +506
  • Côte d’Ivoire +225
  • Croatia +385
  • Cuba +53
  • Cyprus +357
  • Czech Republic +420
  • Denmark +45
  • Djibouti +253
  • Dominica +1
  • Dominican Republic +1
  • Ecuador +593
  • Egypt +20
  • El Salvador +503
  • Equatorial Guinea +240
  • Eritrea +291
  • Estonia +372
  • Ethiopia +251
  • Falkland Islands +500
  • Faroe Islands +298
  • Fiji +679
  • France +33
  • French Guiana +594
  • French Polynesia +689
  • Gabon +241
  • Gambia +220
  • Georgia +995
  • Germany +49
  • Ghana +233
  • Gibraltar +350
  • Greece +30
  • Greenland +299
  • Grenada +1
  • Guam +1
  • Guatemala +502
  • Guernsey +44
  • Guinea +224
  • Guinea-Bissau +245
  • Guyana +592
  • Haiti +509
  • Honduras +504
  • Hong Kong +852
  • Hungary +36
  • Iceland +354
  • India +91
  • Indonesia +62
  • Iran +98
  • Iraq +964
  • Ireland +353
  • Isle of Man +44
  • Israel +972
  • Jamaica +1
  • Japan +81
  • Jersey +44
  • Jordan +962
  • Kazakhstan +7
  • Kenya +254
  • Kiribati +686
  • Kosovo +383
  • Kuwait +965
  • Kyrgyzstan +996
  • Laos +856
  • Latvia +371
  • Lebanon +961
  • Lesotho +266
  • Liberia +231
  • Libya +218
  • Liechtenstein +423
  • Lithuania +370
  • Luxembourg +352
  • Macau +853
  • Macedonia (FYROM) +389
  • Madagascar +261
  • Malawi +265
  • Malaysia +60
  • Maldives +960
  • Mali +223
  • Malta +356
  • Marshall Islands +692
  • Martinique +596
  • Mauritania +222
  • Mauritius +230
  • Mayotte +262
  • Mexico +52
  • Micronesia +691
  • Moldova +373
  • Monaco +377
  • Mongolia +976
  • Montenegro +382
  • Montserrat +1
  • Mozambique +258
  • Myanmar (Burma) +95
  • Namibia +264
  • Nauru +674
  • Nepal +977
  • Netherlands +31
  • New Caledonia +687
  • New Zealand +64
  • Nicaragua +505
  • Niger +227
  • Nigeria +234
  • Niue +683
  • Norfolk Island +672
  • North Korea +850
  • Northern Mariana Islands +1
  • Oman +968
  • Pakistan +92
  • Palau +680
  • Palestine +970
  • Panama +507
  • Papua New Guinea +675
  • Paraguay +595
  • Peru +51
  • Philippines +63
  • Poland +48
  • Portugal +351
  • Puerto Rico +1
  • Qatar +974
  • Romania +40
  • Rwanda +250
  • Saint Barthélemy +590
  • Saint Helena +290
  • Saint Kitts and Nevis +1
  • Saint Lucia +1
  • Saint Martin +590
  • Saint Pierre and Miquelon +508
  • Saint Vincent and the Grenadines +1
  • Samoa +685
  • San Marino +378
  • São Tomé and Príncipe +239
  • Saudi Arabia +966
  • Senegal +221
  • Serbia +381
  • Seychelles +248
  • Sierra Leone +232
  • Singapore +65
  • Sint Maarten +1
  • Slovakia +421
  • Slovenia +386
  • Solomon Islands +677
  • Somalia +252
  • South Africa +27
  • South Korea +82
  • South Sudan +211
  • Spain +34
  • Sri Lanka +94
  • Sudan +249
  • Suriname +597
  • Svalbard and Jan Mayen +47
  • Swaziland +268
  • Sweden +46
  • Switzerland +41
  • Syria +963
  • Taiwan +886
  • Tajikistan +992
  • Tanzania +255
  • Thailand +66
  • Timor-Leste +670
  • Togo +228
  • Tokelau +690
  • Tonga +676
  • Trinidad and Tobago +1
  • Tunisia +216
  • Turkey +90
  • Turkmenistan +993
  • Turks and Caicos Islands +1
  • Tuvalu +688
  • U.S. Virgin Islands +1
  • Uganda +256
  • Ukraine +380
  • United Arab Emirates +971
  • United Kingdom +44
  • United States +1
  • Uruguay +598
  • Uzbekistan +998
  • Vanuatu +678
  • Vatican City +39
  • Venezuela +58
  • Vietnam +84
  • Wallis and Futuna +681
  • Western Sahara +212
  • Yemen +967
  • Zambia +260
  • Zimbabwe +263
Call for our Solutions
Email Us
Explore our solutions
Select Product
Supermarket & Hypermarket Refrigeration Solutions

Supermarket & Hypermarket Refrigeration Solutions

Commercial refrigeration systems for retail food display, back-of-house storage, and cold-chain management, engineered for energy efficiency, food safety compliance, and maximum product visibility across Middle Eastern retail chains.

–
°C
Store electricity consumed by refrigeration
–
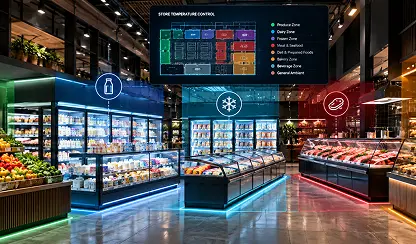
Temperature zones in modern hypermarkets
-
x
Higher energy use of open cases vs closed-door cases
-
/
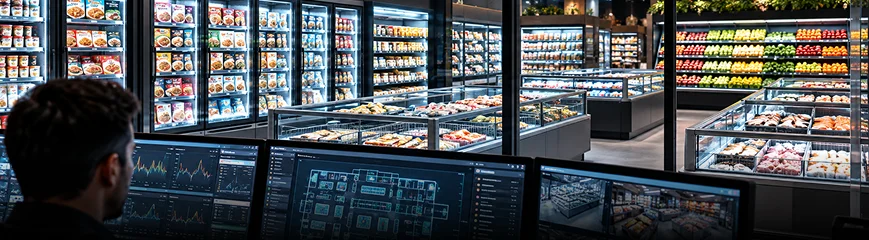
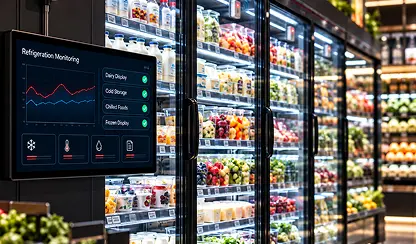
Temperature & refrigeration monitoring

Why Supermarket Refrigeration
Is Different

Seafood requires precise temperature control from catch and receiving through processing, freezing, storage and distribution, with product quality highly sensitive to time and temperature.

06
Critical Challenges
01

Extreme Ambient Conditions

High ambient temperatures, humidity and frequent entrance-door openings increase refrigeration load and energy consumption. Warm air enters the store whenever doors open, increasing the cooling demand. Humidity can also increase moisture levels inside refrigerated areas and affect system performance. Frequent customer movement creates repeated temperature fluctuations across display zones. Proper refrigeration design helps maintain stable product temperatures while managing these additional loads.

Ambient impact: +30–40% refrigeration load
Door-opening frequency drives load spikes
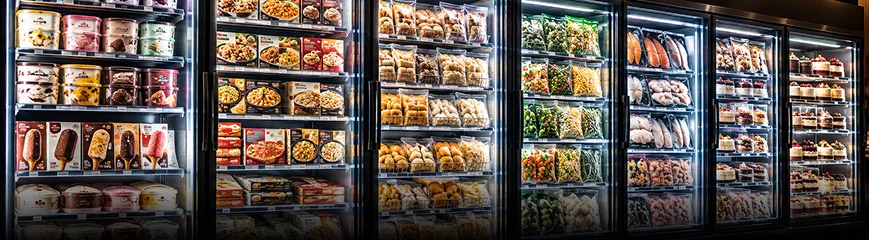
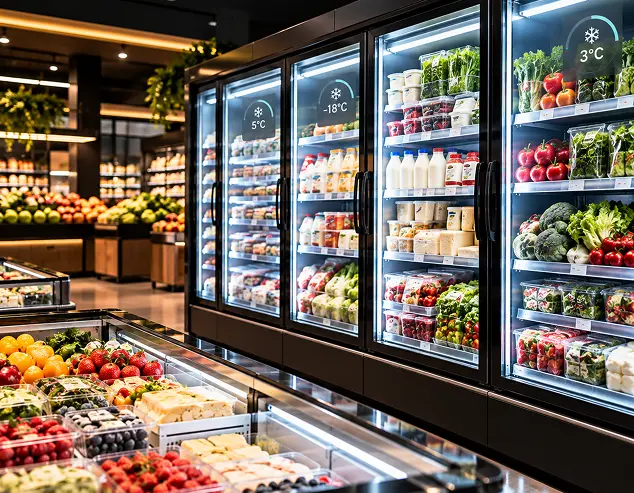
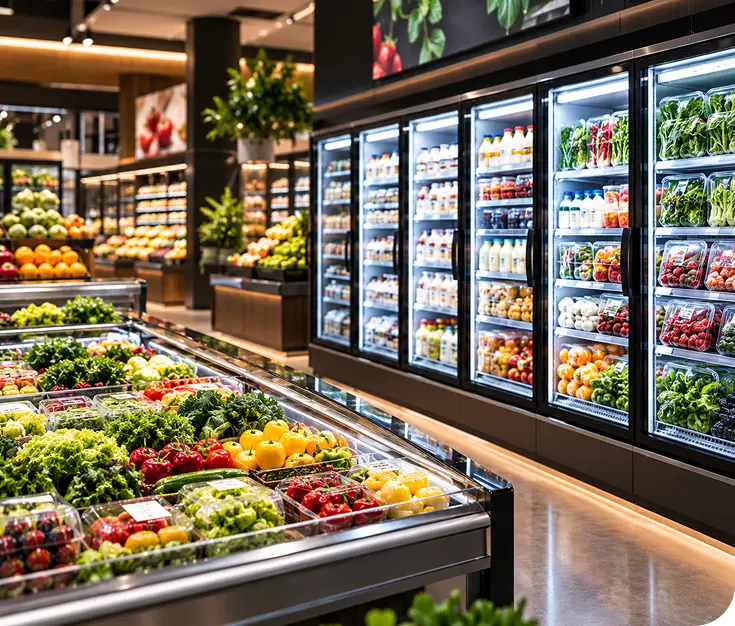
Frozen dairy refrigeration
02

Food Safety Compliance

High ambient temperatures, humidity and frequent entrance-door openings increase refrigeration load and energy consumption. Warm air enters the store whenever doors open, increasing the cooling demand. Humidity can also increase moisture levels inside refrigerated areas and affect system performance. Frequent customer movement creates repeated temperature fluctuations across display zones. Proper refrigeration design helps maintain stable product temperatures while managing these additional loads.

Ambient impact: +30–40% refrigeration load
Door-opening frequency drives load spikes
Multiple Temperature Zones
03

Product Quality & Shrinkage

High ambient temperatures, humidity and frequent entrance-door openings increase refrigeration load and energy consumption. Warm air enters the store whenever doors open, increasing the cooling demand. Humidity can also increase moisture levels inside refrigerated areas and affect system performance. Frequent customer movement creates repeated temperature fluctuations across display zones. Proper refrigeration design helps maintain stable product temperatures while managing these additional loads.

Ambient impact: +30–40% refrigeration load
Door-opening frequency drives load spikes
Saltwater Corrosion
04

Multi-Temperature Operations

High ambient temperatures, humidity and frequent entrance-door openings increase refrigeration load and energy consumption. Warm air enters the store whenever doors open, increasing the cooling demand. Humidity can also increase moisture levels inside refrigerated areas and affect system performance. Frequent customer movement creates repeated temperature fluctuations across display zones. Proper refrigeration design helps maintain stable product temperatures while managing these additional loads.

Ambient impact: +30–40% refrigeration load
Door-opening frequency drives load spikes
International Compliance
05

Peak-Hour Performance

High ambient temperatures, humidity and frequent entrance-door openings increase refrigeration load and energy consumption. Warm air enters the store whenever doors open, increasing the cooling demand. Humidity can also increase moisture levels inside refrigerated areas and affect system performance. Frequent customer movement creates repeated temperature fluctuations across display zones. Proper refrigeration design helps maintain stable product temperatures while managing these additional loads.

Ambient impact: +30–40% refrigeration load
Door-opening frequency drives load spikes
High-Value Product Preservation
06

Water Usage & Environmental Pressure

High ambient temperatures, humidity and frequent entrance-door openings increase refrigeration load and energy consumption. Warm air enters the store whenever doors open, increasing the cooling demand. Humidity can also increase moisture levels inside refrigerated areas and affect system performance. Frequent customer movement creates repeated temperature fluctuations across display zones. Proper refrigeration design helps maintain stable product temperatures while managing these additional loads.

Ambient impact: +30–40% refrigeration load
Door-opening frequency drives load spikes
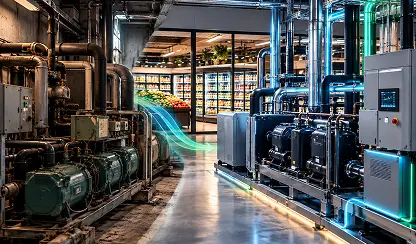
Water Usage & Environmental Pressure

High ambient temperatures, humidity and frequent entrance-door openings increase refrigeration load and energy consumption. Warm air enters the store whenever doors open, increasing the cooling demand. Humidity can also increase moisture levels inside refrigerated areas and affect system performance. Frequent customer movement creates repeated temperature fluctuations across display zones. Proper refrigeration design helps maintain stable product temperatures while managing these additional loads.

Ambient impact
+30–40% refrigeration load
Door-opening frequency
Drives load spikes
Extreme Ambient Conditions

Maintaining consistent refrigeration conditions is essential for food safety and product protection. Temperature fluctuations, high ambient conditions and frequent door openings can affect refrigerated display areas. Proper refrigeration design helps maintain stable product temperatures and supports safe storage conditions across the store.

Ambient impact: +30–40% refrigeration load
Door-opening frequency drives load spikes
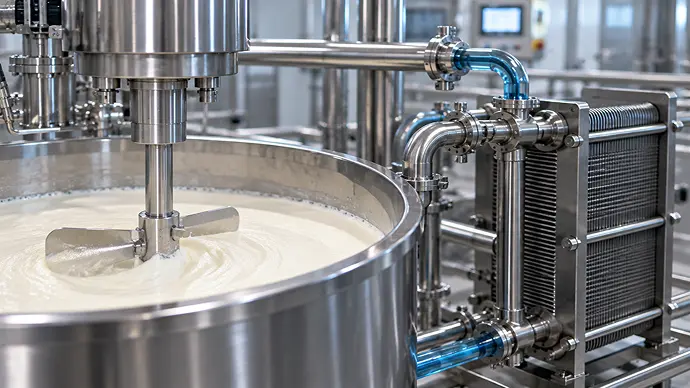
Food Safety Compliance

Temperature fluctuations and inconsistent refrigeration can affect product quality and increase shrinkage. Dairy products require stable refrigerated conditions to maintain freshness, appearance and shelf life. Effective refrigeration helps reduce temperature variations and protect products throughout the retail environment.

Ambient impact: +30–40% refrigeration load
Door-opening frequency drives load spikes
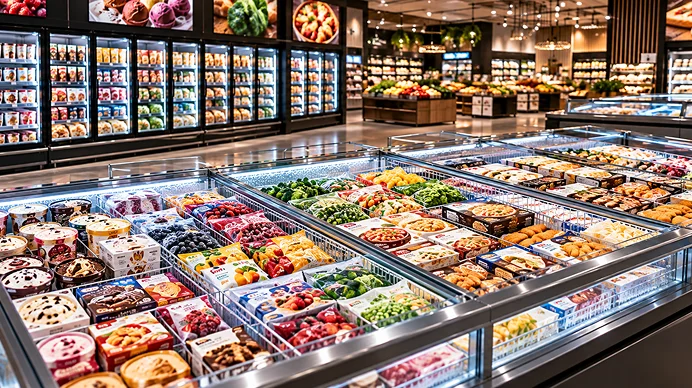
Product Quality & Shrinkage

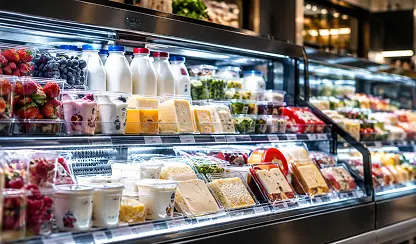
Supermarkets and dairy retail environments often require multiple temperature zones for different products and applications. Each zone must maintain the appropriate operating conditions while working as part of an integrated refrigeration system. Proper system design helps maintain temperature stability across different refrigerated areas.

Multiple temperature zones require dedicated control
Stable temperatures across refrigerated display areas
Multi-Temperature Operations

Peak shopping hours create increased refrigeration demand due to frequent customer movement and repeated opening of refrigerated display doors. These load spikes can affect temperature stability and system performance. Refrigeration systems must be designed to handle peak-hour conditions while maintaining consistent product temperatures.

Ambient impact: +30–40% refrigeration load
Door-opening frequency drives load spikes
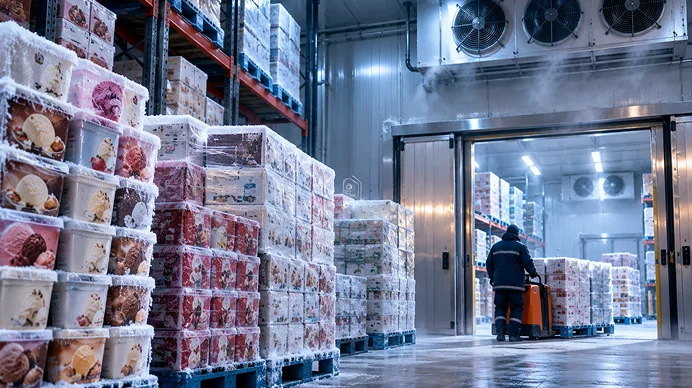
Peak-Hour Performance

Refrigeration systems must balance cooling performance with efficient use of water and energy. Environmental pressures are increasing the need for efficient refrigeration technologies, reduced resource consumption and responsible system design. Optimised systems can help reduce operational impact while maintaining reliable cooling performance.

Efficient water and energy usage
Environmentally responsible refrigeration system design
Water Usage & Environmental Pressure

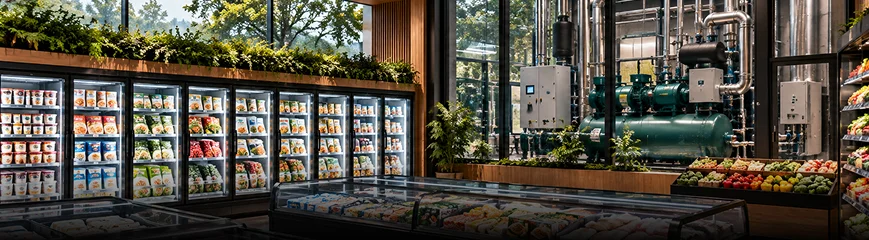
One Retail Environment Multiple Critical Temperatures.

Nine zones, each with its own thermal target. A failure at any single point compromises product quality and food safety.

Ice cream processing equipment

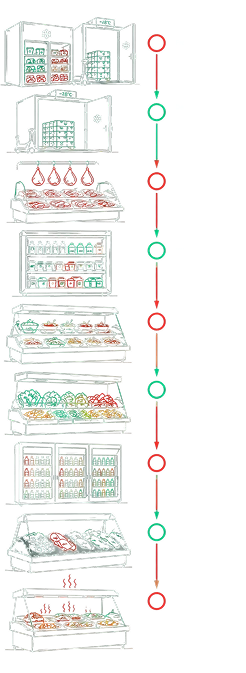
One Cold Chain, Multiple
Critical Temperatures.

Six stages, each with its own thermal target. A failure at any single point compromises everything downstream.

−20°C to −22°C

Frozen foods and ice cream displayed for customer access while holding deep-frozen product temperature.

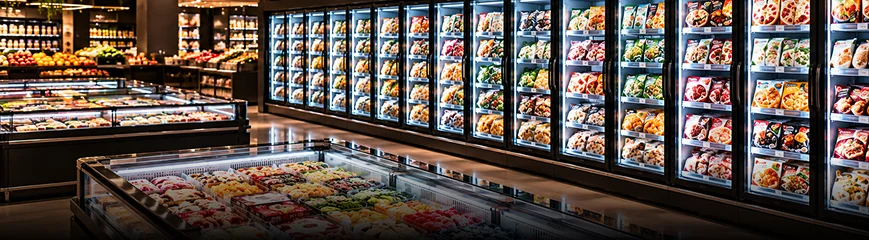
Frozen Display
Category Frozen Display
−25°C to −30°C

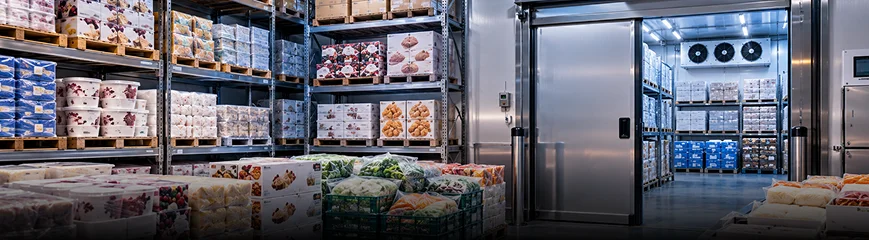
Back-of-house frozen storage holding inventory before it reaches the sales floor.

Deep Freeze Storage
Category Deep Freeze Storage
0°C to 2°C

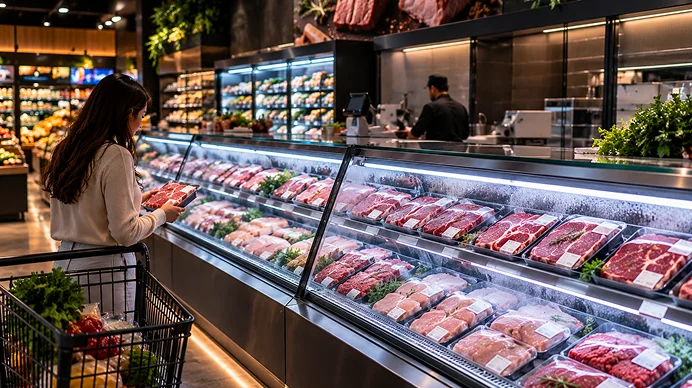
Fresh meat counters requiring stable low-temperature display with frequent customer access.

Chilled Meat
Category Chilled Meat
2°C to 4°C

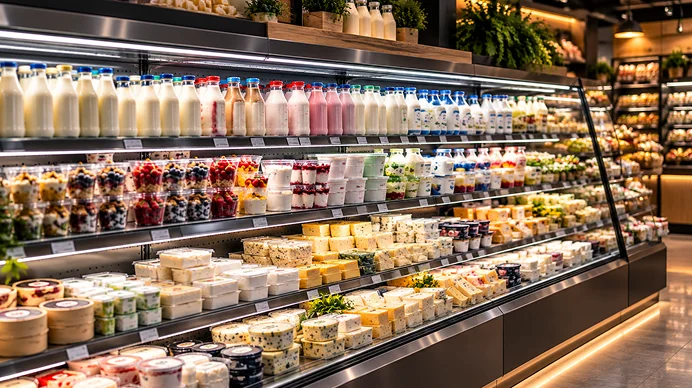
Milk, cheese and yogurt held in controlled chilled display and storage environments.

Chilled Dairy
Category Chilled Dairy
0°C to 4°C

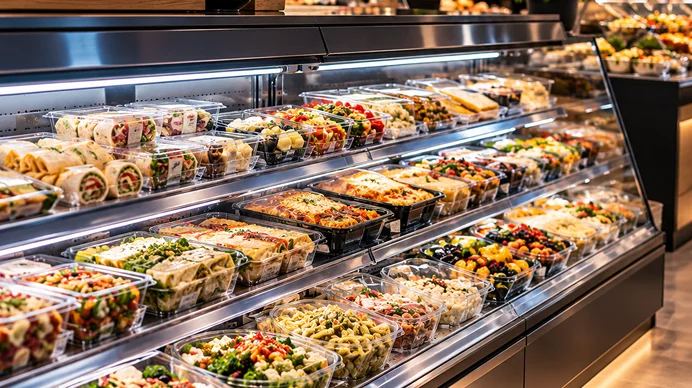
Sliced meats, salads and prepared foods requiring strict temperature and food-safety control.

Deli & Prepared Foods
Category Deli & Prepared Foods
4°C to 12°C

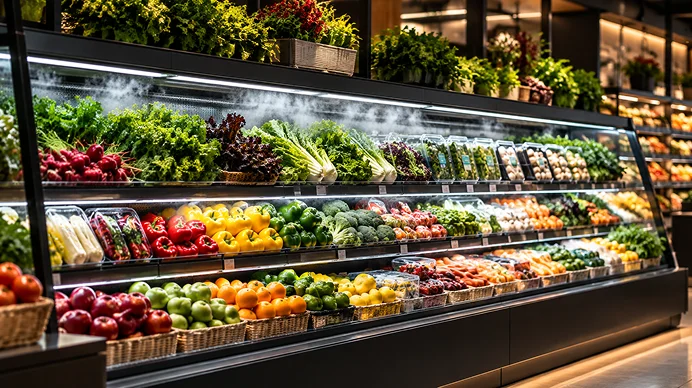
Product-specific temperature and humidity control to preserve freshness and reduce moisture loss.

Fresh Produce
Category Fresh Produce
2°C to 6°C

Chilled beverage displays engineered for consistent temperature under high footfall.

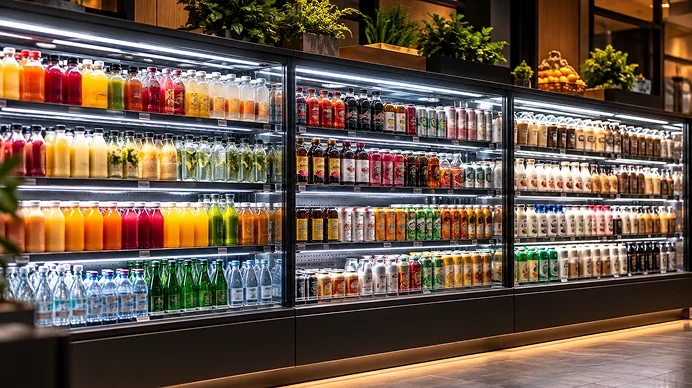
Beverage Display
Category Beverage Display
−1°C to 2°C

Premium fresh seafood requiring the tightest, most stable low-temperature display conditions.

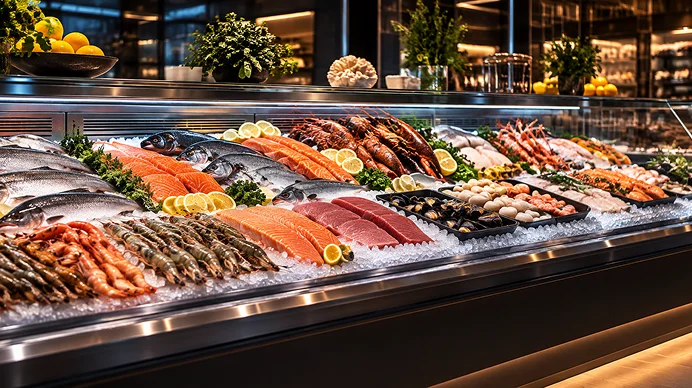
Seafood Bar
Category Seafood Bar
60°C+

Cooked and ready-to-eat foods held above the safe hot-holding threshold until sale.

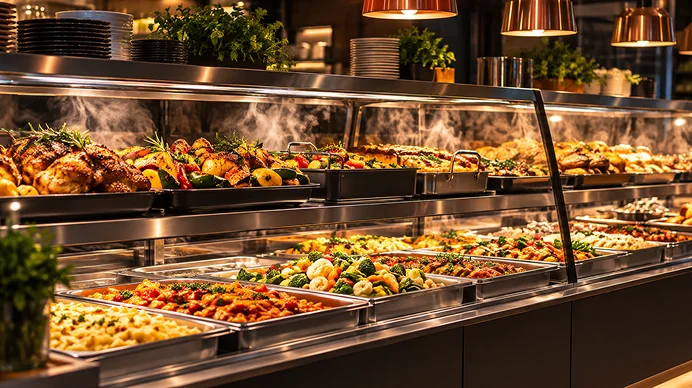
Hot Food
Category Hot Food

Engineered Around Your Retail Environment

Select a store format to see estimated refrigeration load.

Estimated Facility Load

0 0

Get Facility Load Assessment

Temperature Control Protects
More Than the Product

Product temperature, not simply display-case air temperature, should be monitored using appropriate probes.

0–2°C
Target zone — minimal food safety risk
Product Temperature Risk Visualization
-30°C
-25°C
-20°C
-18°C
-15°C
-12°C
Smooth Slightly Coarse Icy Unacceptable
0–2°C Target Zone — minimal food safety risk
2–4°C Acceptable — low risk
4–6°C Monitor — moderate risk
6–8°C Corrective Action — high risk
8–10°C Critical — very high risk
>10°C Immediate Action — critical product risk

Complete Refrigeration Solutions for Retail

Six system categories, engineered together as one continuous cold chain rather than sold as isolated equipment.

On-Board Refrigeration

REFRIGERATED DISPLAY CASES

Best For Commercial fishing
vessels
Capacity 10–50
Tonnes/day
Temperature -25°C to -40°C
  • Marine-grade construction for vessel environments
  • Immediate post-catch cooling
  • Supports protection against ultra-rapid deterioration

Specifications

Refrigeration equipment engineered for the vessel environment, providing immediate cooling from the point of catch.

Power Draw 50–150 kW typical draw
Investment Range Scales with vessel hold capacity
Quality Outcome Immediate catch preservation and maximum freshness

Complete Refrigeration Solutions for
Retail

Six system categories, engineered together as one continuous cold chain rather than sold as isolated equipment.

Open and closed multi-deck refrigerated display cases
Best For Retail food
display
Capacity Modular, per-store
configuration
Temperature −22°C to 12°C
  • Open and closed formats for different retail applications
  • Category-specific temperature and humidity control
  • Engineered for product visibility and access

Specifications

Multi-deck display cabinets with dedicated evaporator coils, air-curtain or glass-door configurations, and category-specific control setpoints.

Power Draw 6–25 kWh/day/case (category-dependent)
Investment Range Scales with case count and format
Quality Outcome Stable display temperature with strong product presentation
Glass-door freezer and chiller display units
Best For Energy-efficient chilled
and frozen display
Capacity Modular, per-store
configuration
Temperature −22°C to 4°C
  • Substantially lower energy consumption than open cases
  • Improved temperature stability with reduced infiltration
  • Reduces cold-air spillage into the sales floor

Specifications

Sealed glass-door cabinets with anti-fog/anti-condensation glazing, dedicated refrigerant circuits and door-open sensing.

Power Draw 3–5× lower draw than equivalent open cases
Investment Range Scales with case count
Quality Outcome Stronger temperature stability and lower shrinkage
Back-of-house chilled and frozen storage cold rooms
Best For Inventory and
product staging
Capacity 20–500 m²
per room
Temperature −30°C to 4°C
  • Dedicated chilled and frozen storage for incoming inventory
  • Buffer capacity ahead of the sales floor
  • Supports HACCP cold-chain documentation

Specifications

Insulated modular panel construction with dedicated refrigeration plant, floor-level temperature monitoring and alarm systems.

Power Draw 30–50 kWh/day/m²
Investment Range Scales with room volume and temperature class
Quality Outcome Stable holding temperature ahead of display
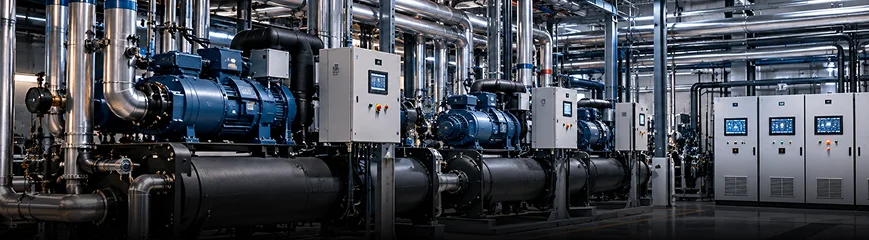
Central refrigeration plant room serving multiple retail zones
Best For Large multi-zone
retail facilities
Capacity 400–2,500
kW
Temperature Multiple zones,
single plant
  • Single plant serving multiple temperature zones
  • Improved efficiency versus standalone unit systems
  • Centralized monitoring and control

Specifications

Centralized compressor racks distributing refrigerant or secondary coolant to display cases and cold rooms across the store.

Power Draw 400–2,500 kW plant capacity
Investment Range Scales with store size and zone count
Quality Outcome Consistent performance across all zones
Transcritical CO₂ refrigeration rack
Best For Lower-GWP refrigeration
strategy
Capacity Modular to
full-store scale
Temperature Multiple zones,
single plant
  • CO₂ and R290 solutions support lower-GWP strategies
  • Compatible with heat-recovery applications
  • Future-proofs systems against refrigerant phase-downs

Specifications

Transcritical CO₂ or R290 compressor racks with gas coolers, ejector or parallel-compression technology for hot-climate efficiency.

Power Draw Comparable to HFC systems with heat-recovery upside
Investment Range Higher upfront, lower lifecycle refrigerant cost
Quality Outcome Lower-GWP operation without compromising performance
Digital refrigeration monitoring and control dashboard
Best For Store-wide refrigeration
oversight
Capacity Single-store to
multi-store networks
Temperature All zones
  • Digital temperature monitoring across all refrigerated zones
  • Centralized control and alarm management
  • Refrigeration performance management and reporting

Specifications

Networked sensors and controllers feeding a central monitoring platform, with remote alerting and standardized configuration across stores.

Power Draw All refrigerated zones, single-store or multi-store
Investment Range Scales with store and network coverage
Quality Outcome Faster response to excursions, stronger compliance records

The Right Temperature for Every Frozen Dairy Product

Fresh Whole Fish

Fresh Produce

High-humidity display environments designed to support freshness while controlling temperature and moisture.

Storage 0–2°C
Critical Control Immediate chilling post-catch
Shelf Life 10–14 days

What matters most for your facility?

Recommended system Continuous Ice Cream Freezers

Built for Food Safety, Compliance & Traceability

Temperature records and standards documentation built into every installation.

HACCP
Temperature Monitoring
Audit Trails
Calibration
Staff Training

Temperature Monitoring Dashboard / Sensor Map

-21°C Frozen Display
1°C Chilled Meat
6°C Deli
0°C Seafood
5°C Dairy

Traceability & Documentation

Temperature Logs
Calibration Certificates
Corrective Action Records
Audit Trails
Staff Training Records
HACCP Documentation

Lower Refrigeration Energy Without Compromising Product Quality

Refrigeration energy efficiency
Recover condenser heat for useful hot-water applications across the store.
5–8% savings
Reduce energy consumption from open cases during closed hours.
10–15% savings
Reduce refrigeration demand in suitable frozen and dairy applications.
15–25% savings
CO₂ and R290 systems support lower-GWP refrigeration strategies.
5–10% savings
Demand defrost, floating suction and adaptive controls across the plant.
8–12% savings
Airflow management, correct loading and regular cleaning of display cases.
3–6% savings
Peak-load management through thermal energy storage.
5–9% savings
Reduce refrigeration demand during appropriate closed-hour periods.
3–5% savings
0
Potential energy savings through optimized refrigeration strategies.

Refrigeration Performance You Can Measure

Client Profile

Major hypermarket chain, Saudi Arabia — 45 stores, 8,000 m² average store size.

Challenge

High refrigeration energy consumption and inconsistent temperature performance across a growing multi-store estate.

Solution Implemented

Transcritical CO₂ refrigeration with heat recovery and IoT-based monitoring installed as a standardized system across the network.

Read More
31 %
Energy reduction
$149K
Annual energy savings/store
0
Unplanned outages (18 months)
5.2 Years
Payback period
ROI ANALYSIS

What Does Better Refrigeration Return to Your Business?

$0M 5-Year Benefit
0% 5-Year ROI
0 Years Payback
0% IRR
Better Refrigeration Return
Lower Energy Consumption
34%
Lower Product Shrinkage
26%
Fewer Breakdowns
20%
Better Compliance
12%
Better Customer Experience
8%
ROI BY SYSTEM TYPE
SYSTEM
INITIAL INVESTMENT
ANNUAL ADDED VALUE
PAYBACK
IRR
Refrigerated Display Cases
$0.2M–$0.6M
$60K–$140K/yr
2.5–3.8 yrs
26–34%
Glass Door Refrigeration
$0.3M–$0.7M
$90K–$180K/yr
2.2–3.2 yrs
30–40%
Back-of-House Rooms
$0.4M–$0.9M
$100K–$190K/yr
2.8–3.8 yrs
24–32%
Central Refrigeration Systems
$0.8M–$1.4M
$180K–$320K/yr
2.5–3.6 yrs
28–36%
Natural Refrigerant Systems
$0.7M–$1.6M
$190K–$340K/yr
3.0–4.2 yrs
22–30%
ADDITIONAL BUSINESS BENEFITS
Brand Value Premium
Market Expansion
Risk Reduction
Customer Loyalty
Operational Efficiency
Sustainability Credentials
Retail Relationships
Future-Proof Compliance
Asset Value
Competitive Advantage

Supermarket Refrigeration Questions, Answered

Ice cream should be held at -25°C to -30°C for long-term cold storage. Retail display cabinets typically maintain -18°C to -22°C through point of sale.

Continuous freezing (4°C → -5°C/-8°C) incorporates air and forms initial ice structure in 30–60 seconds. Hardening then drives core temperature from -6°C down to -25°C over 20–60 minutes, locking that structure in place before storage.

Investment scales with throughput and zone configuration — tunnel hardening systems in comparable installations have ranged from roughly $0.9M to $1.6M, with 5-year ROI in the range of 38–48% IRR. A facility assessment gives an accurate figure for a specific throughput target.

Temperature fluctuations above the hardening curve cause small ice crystals to melt and refreeze into larger ones. Crystal size above 60–80 μm reads as noticeably icy, and above 80 μm quality is considered unacceptable.

<40 μm Smooth, creamy
40–60 μm Slightly coarse
60–80 μm Noticeably icy
>80 μm Unacceptable quality
>100 μm Product rejection likely

Heat shock is the repeated partial thawing and refreezing of ice cream from inconsistent storage or transport temperatures. Each additional shock compounds crystal growth: 1–3 shocks add 20–40% to baseline crystal size, 4–6 shocks add 40–80%, 7–10 shocks add 80–160%, and more than 10 shocks can add 200% or more. A typical GCC distribution chain sees 3–8 heat shock events.

Soft serve mix is held unhardened at -4°C to -6°C in storage and 2°C to 4°C during transport, then dispensed fresh at -5°C to -7°C at point of service.

FDA 21 CFR Part 135 sets identity and compositional standards for frozen dairy products; refrigeration systems are designed to support the temperature and microbiological control points required to meet it, alongside Codex Alimentarius, EU food information requirements and GCC/GSO standards.

HACCP critical control points are tied to both temperature and microbiological limits at each production stage.

Total Plate Count ≤ 100,000 CFU/g
Coliforms ≤ 10 CFU/g
E. coli Negative /1g
Salmonella spp. Negative /25g
Listeria monocytogenes Negative /25g
S. aureus ≤ 100 CFU/g

Heat recovery (8–12% savings), variable-speed compressors (10–15%), efficient defrost (3–5%), building insulation (4–7%), door optimization (2–4%), thermal storage (5–9%) and ongoing system optimization (3–6%) together can reduce hardening-stage energy consumption by 20–30%.

Maintenance is scheduled across five intervals to keep the cold chain within tolerance.

Daily Visual inspection, temperature log review, alarm checks
Weekly Condenser/evaporator coil inspection, door seal checks
Monthly Filter cleaning or replacement, refrigerant level checks
Quarterly Compressor performance testing, calibration verification
Annually Full system audit, refrigerant leak testing, insulation inspection

Distribution temperature is protected through a defined process from dispatch to retail handoff.

Vehicle pre-cooling
Rapid loading
Loading-area temperature control
GPS temperature monitoring
Driver training
Backup systems
Route optimization
Retail handoff

Retail freezer cabinets should maintain -18°C to -22°C, drawing 8–15 kWh per day per cabinet, to preserve texture and shelf life through the point of sale.

Fat content, overrun and sugar or stabilizer systems all shift the freezing and hardening curve — for sensitive formulations, ±1°C control can be critical. Reduced-fat and sugar-free formulations in particular require tighter tolerances than standard recipes.

Shelf life drops sharply as storage temperature rises.

-30°C 18–24 months
-25°C 12–18 months
-20°C 9–12 months
-18°C 6–9 months
-15°C 3–4 months
-12°C 4–8 weeks
-10°C 2–4 weeks
Premium ice cream products in cold storage

Let's Build a Smarter Retail Cold Chain.

Tell us about your store format, refrigeration requirements and operational priorities.

Request a Quote

Tell us more about yourself and what you have got in mind.

Eco-Smart, Turnkey Cooling Solutions
for Tomorrow

We provide advanced commercial cooling solutions that reduce emissions and drive energy-efficient, sustainable performance.

Request a Quote

Tell us more about yourself and what
you have got in mind.